
The AI boom
Can the performance of clients predict stock movements?


Everyone has seen booming AI stocks recently. Organizations that produce or design and develop advanced chips that train AI models, like TSMC and NVIDIA have surged because of the AI boom. We can look further down the supply chain beyond the chip producers like Taiwan Semiconductor Manufacturer Company (TSMC). There we find ASML, a company that produces photolithography machines which are essential to create advanced chips. ASML has lagged behind the tech stocks by dropping nearly 30% since its peak in july 2024. The stock price has suffered mainly due to restrictions, while the fundamentals are still very solid. If clients of ASML are performing well, it could take a while until ASML's revenue increases. Producing the advanced machines is also a time consuming affair. It kept me wondering, the customers of ASML are doing so well, does their long- and short-term historical share price influence ASML's share price?
The customers of ASML
Who are the customers of ASML? There is no public documentation on the exact specification on all ASML's clients. TSMC, Intel Corp, and Samsung Electronics are the biggest clients of ASML Fitch Ratings (2024), and SMIC and SK Hynix have been found to be significant customers of ASML Reuters (2025).
TSMC (Taiwan Semiconductor Manufacturing Company) is one of the largest semiconductors and circuits producers in the world, it focuses solely on producing for large customers. SMIC (Semiconductor Manufacturing International Corporation) is a chinese based semiconductor foundry whose revenue comes from producing chips. SK Hynix Inc is a South Korean based chip producer with a main focus on memory chips. Intel is a semiconductor manufacturing corporation that designs, manufactures, and sells mainly computer components. Samsung electronics is a broader organization that develops, produces and sells many different products in the technology sector.
There is some difference in the type of clients ASML has, some are only focusing on producing chips on a large scale, while other organisations are big tech companies. Below I included a correlation bar chart based on the daily returns of the assets above with ASML returns since 2021. Most assets are positively correlated, this result alone does not tell us a lot. TSM has the highest overall correlation. This is not suprising since it is one of the largest clients of ASML, and their whole business model is producing chips. But do returns of TSM have any predictive value for the returns of ASML?
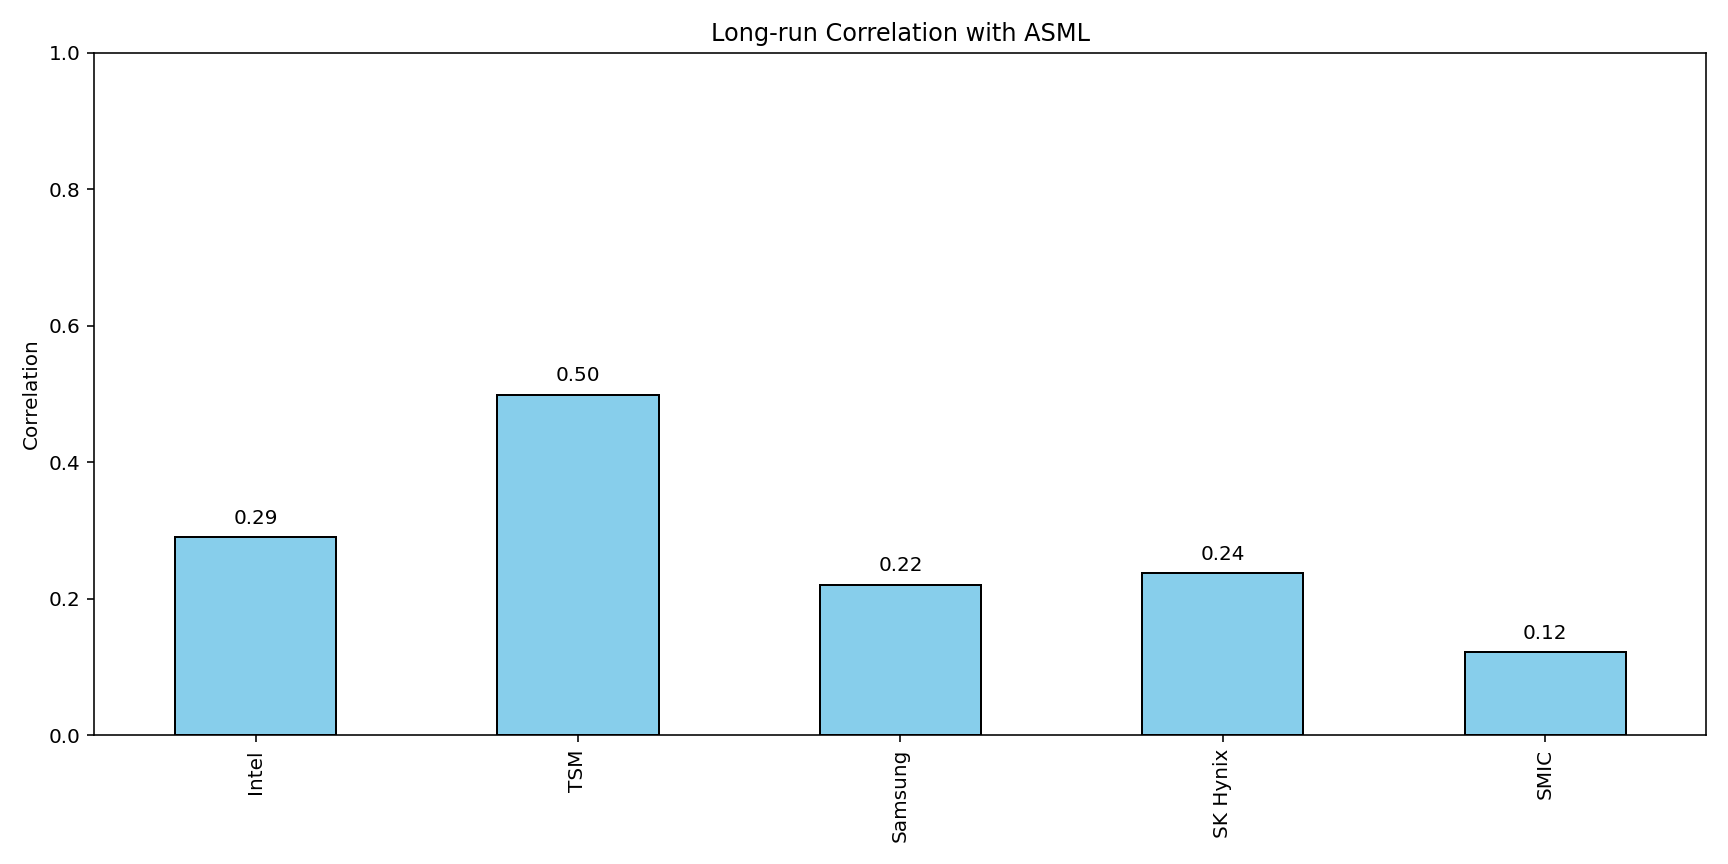
Figure 1
Can TSM and other clients returns predict ASML prices?
Short term
For the short term test, I downloaded daily return data of ASML and its customers from the first of april 2021 up until now. I use a Granger Causality test that tests if the past returns of TSM hold predictive power over the return of ASML. A Granger causality test assumes stationary time series. I used a Dickey-Fuller test to check if the returns are a stationary time series. The Granger Causality is as follows.
yt = α0 + Σᵖᵢ₌₁ αᵢyt₋ᵢ + Σᵖᵢ₌₁ βᵢxt₋ᵢ + εt. (1)
Where yᵢ is the current observed return of ASML and the first sum contains all the lagged previous returns of ASML with coefficients αᵢ. The second sum contains previous observed returns of TSM with coefficients βᵢ. The test determines if the coefficients of TSM are significantly different from zero or not, i.e., if they have any predictive value.
According to the Granger causality test the returns of TMS hold significant predictive value over the return of ASML on a given day. The specific strength of predictability is not determined with this model. We only know the historic returns of TMS are an indicator of the ASML returns. In the graph below we see the lags (amount of previous TMS returns used to estimate the ASML return on a day). The y-axis contains the p-value for different amount of historical returns of TSM as predictors. The y-axis contains the p-value, a lower p-value means we are more certain there is an effect. The best predictor is using the previous day's return of TMS. That is in a sense intuitive, older returns carry less information compared to yesterday's return. Since the model is based on ASML's past returns and TSM past returns, it indicates the added value of using TSM returns besides only using ASML returns. Important to note is that we have not found a direction of the effect, the direction of the effect can be different for various lags.
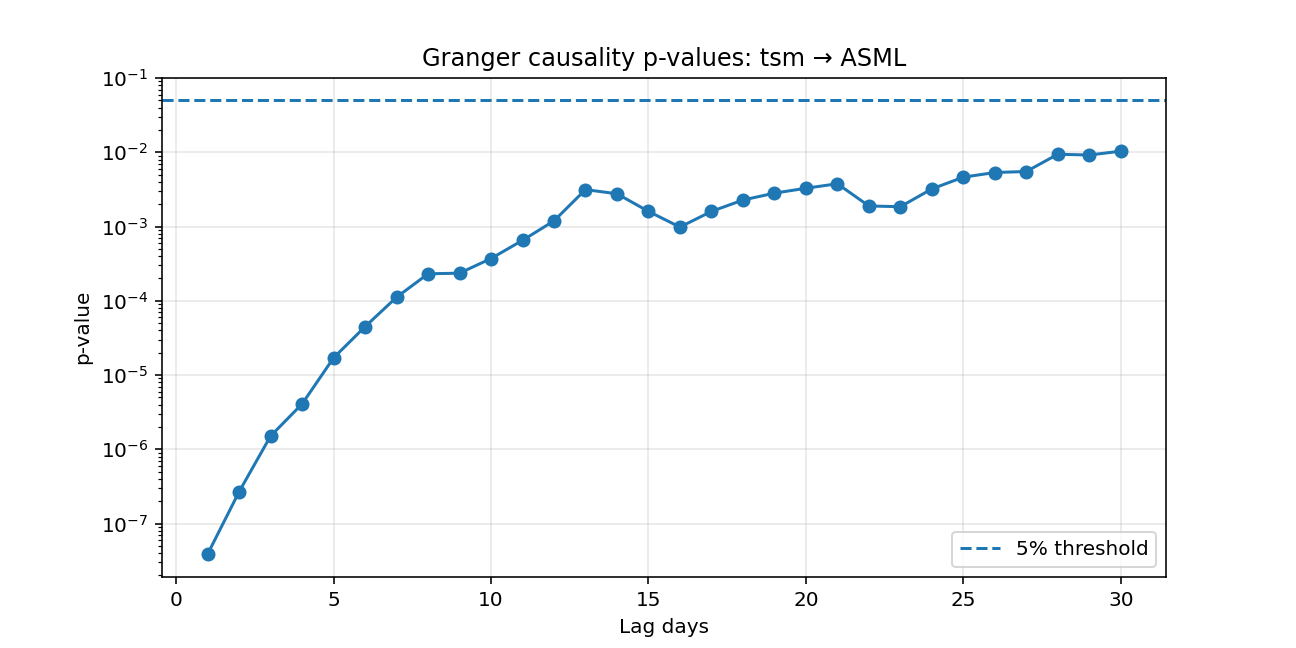
Figure 2
Apparently the biggest client of ASML which is focused purely on chip producing has predictive value over the future returns of the ASML stock, will this hold for other clients of ASML?
I performed the same test with the other clients of ASML to check for similarities. For SK Hynix there was no predictive power according to the test and given the data. For the other clients SMIC, Intel, and Samsung there was significant predictive power. For intel we have similar results to TSM, historical prices have predictive prices for the returns of ASML, and yesterday's price is the best predictor. For Samsung Electronics only the past two days of returns have a significant predictive effect. And suprisingly, for SMIC only higher lags have significant predictive power. Namely the return of the past 30 days seem to have a significant effect on the return of ASML.
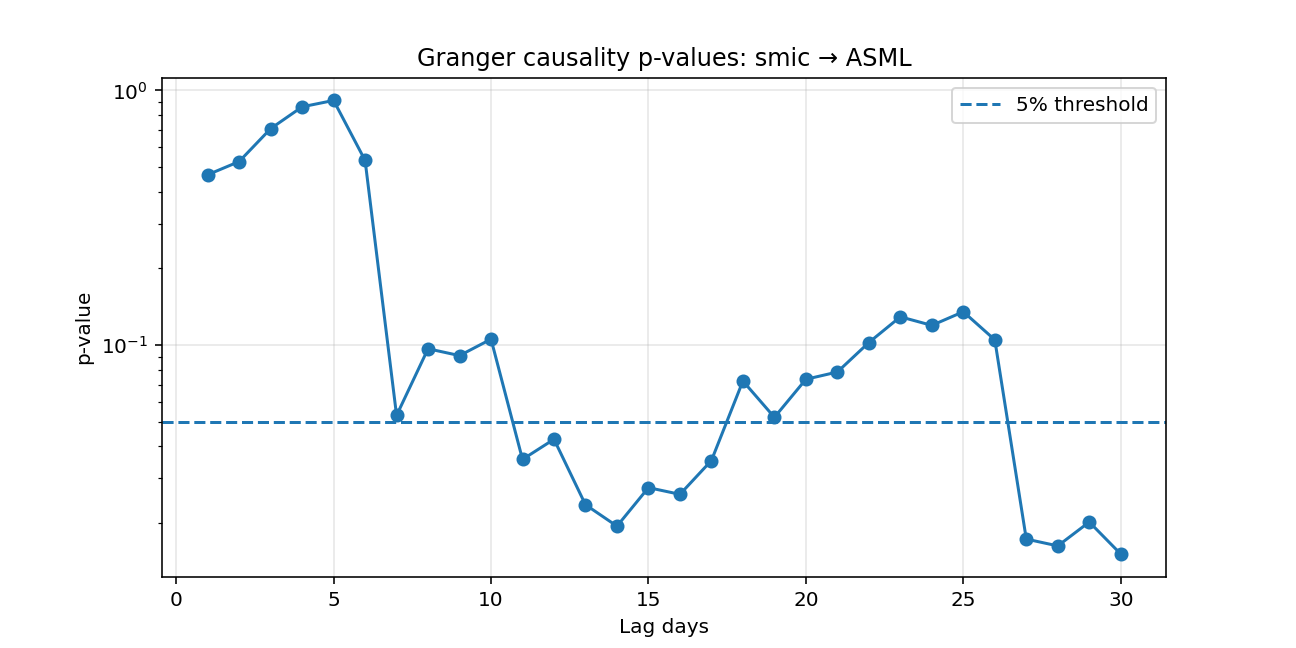
Figure 3
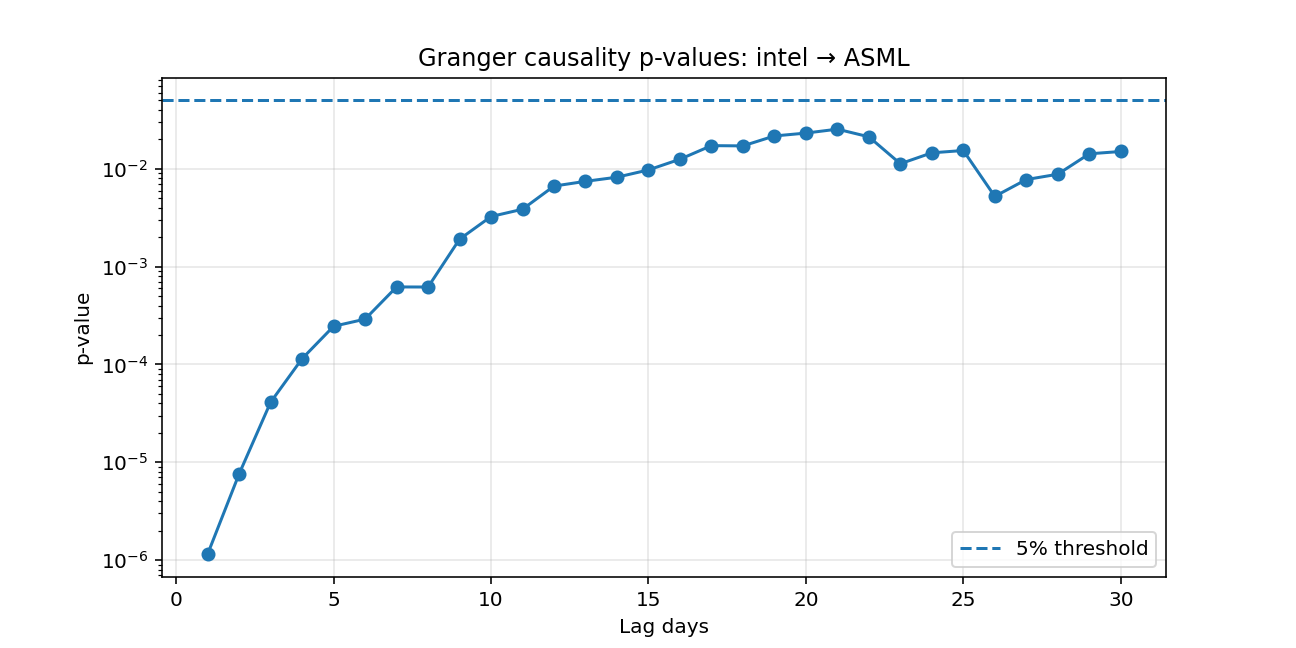
Figure 4
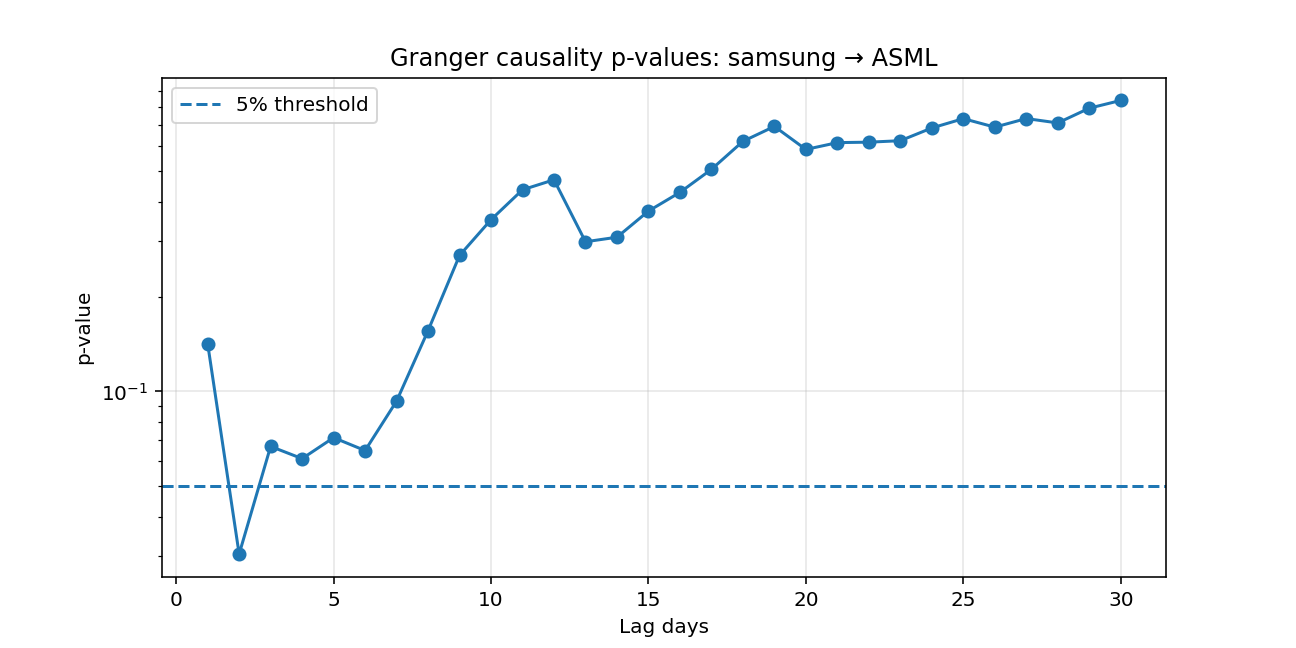
Figure 5
Long term
Testing for more long-term effect is very interesting, in a longer time frame there can be trends. And if a client is doing well, there is likely a significant lag until ASML potentially delivers new advanced machinery for the client. For illustration, ASML's most advanced machine the 'EUV' can take one and half year to produce.
To test for long-term effects, I use the same test but download monthly return data instead of daily return data. I downloaded the monthly returns starting from January 2015 up until now. The total observations will be less than the test before. However, we still have enough to perform the Granger Causality test. Below are the results for each client, SK Hynix, SMIC, and Samsung's return do not hold any significant predictive power over ASML according to the test. So we will leave those graphs out.
Intel returns seem to have significant predictive capabilities with 2-3 months of lagged returns, so still not quite long term effects. However, for TSM we see many lags of historical prices that seem to have significant predictive power. The most significant seems to be 6 months of lag, so the returns of the past 6 months of TSM are the best indicator of ASML's share return according to the Granger test. Most lagged monthly retuns of TSM are significant predictors of ASML's return according to the Granger test. It seems TSM is a strongly intertwined client of ASML whose share price are more connected compared to the other clients.
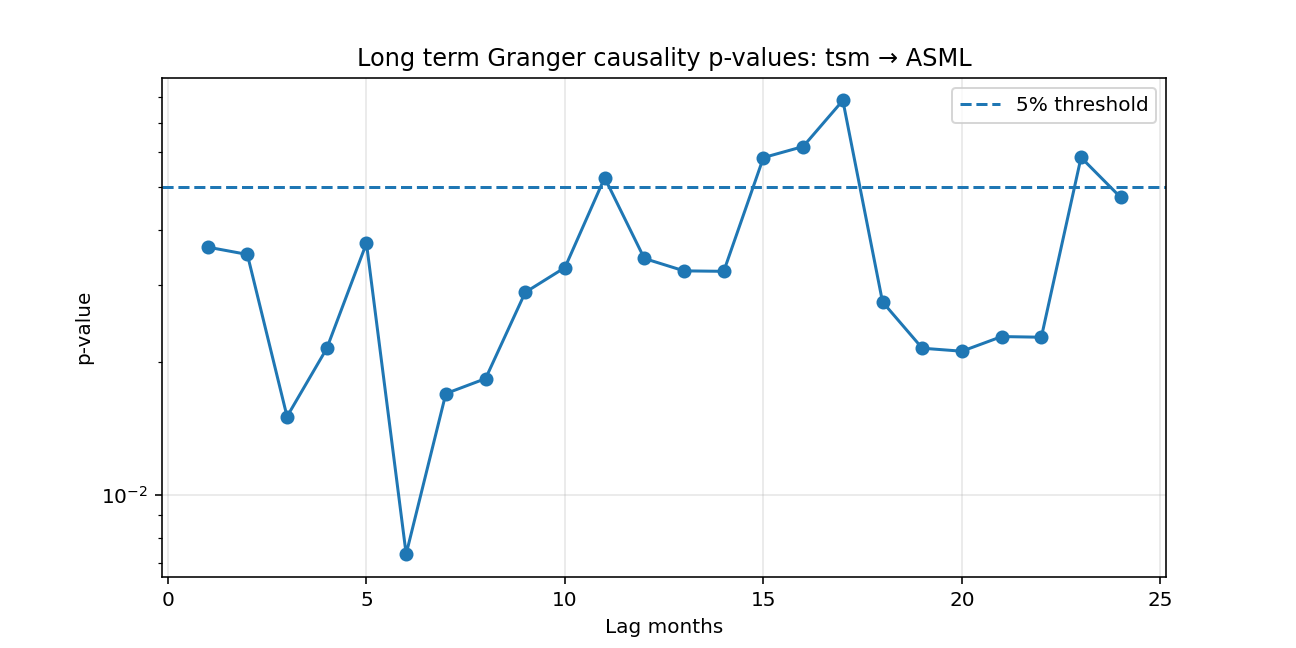
Figure 6
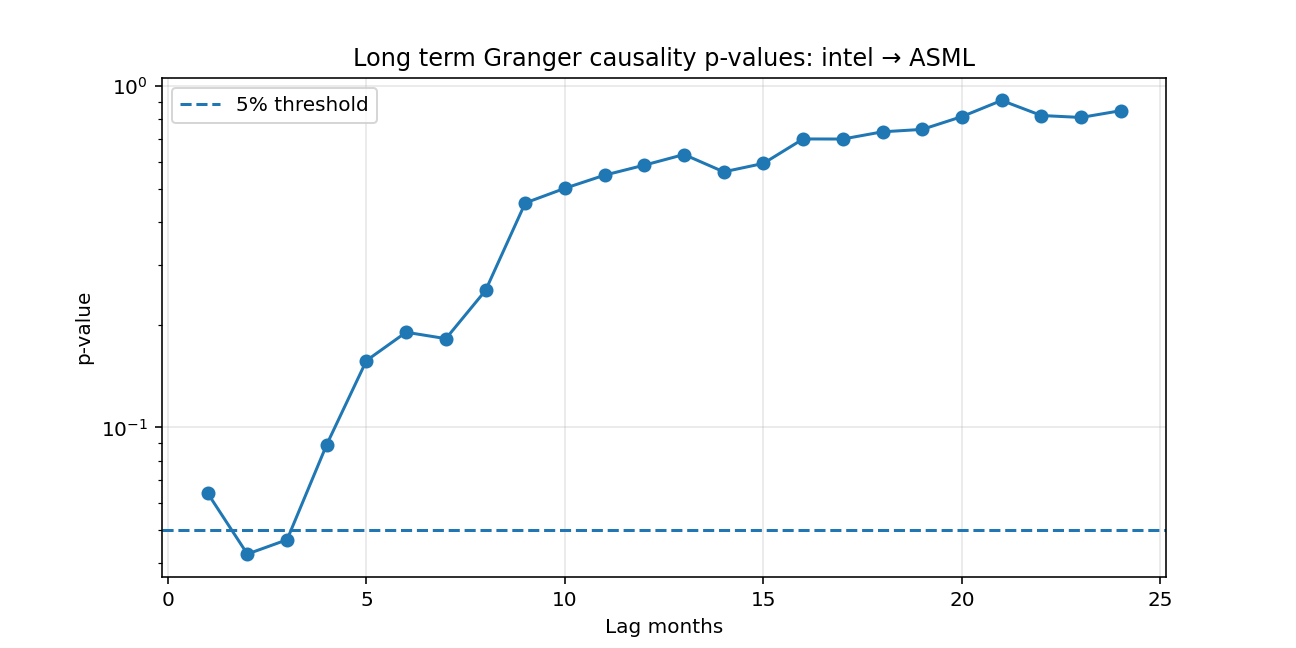
Figure 7
The tests performed above are all based on the share price. This price is ofcourse subject to many factors like speculation. As a quick check I performed the same test to the year-on-year quarterly revenue growth rates, and the quarter-on-quarter revenue growth rates of tsm and asml. I chose to use them both to see if the revenue growth rate has some predictive effect or exist due to seasonality. I found that using the past four quarterly growth rates of tsm has significant preditive value over the next quarterly growth rate of asml. Investigating the coefficients of the lagged model we can see the fourth lag of the quarterly growth has the highest coefficient. This is true for both versions of the quarterly revenue. This is in line with our thoughts: It takes a while for increasing demand in chips to reach ASML. The model finds that an increase in quarterly year-on-year revenue will influence ASML the most exactly one year in the future. On shorter term there is also effect, but the effect is strongest one year into the future.
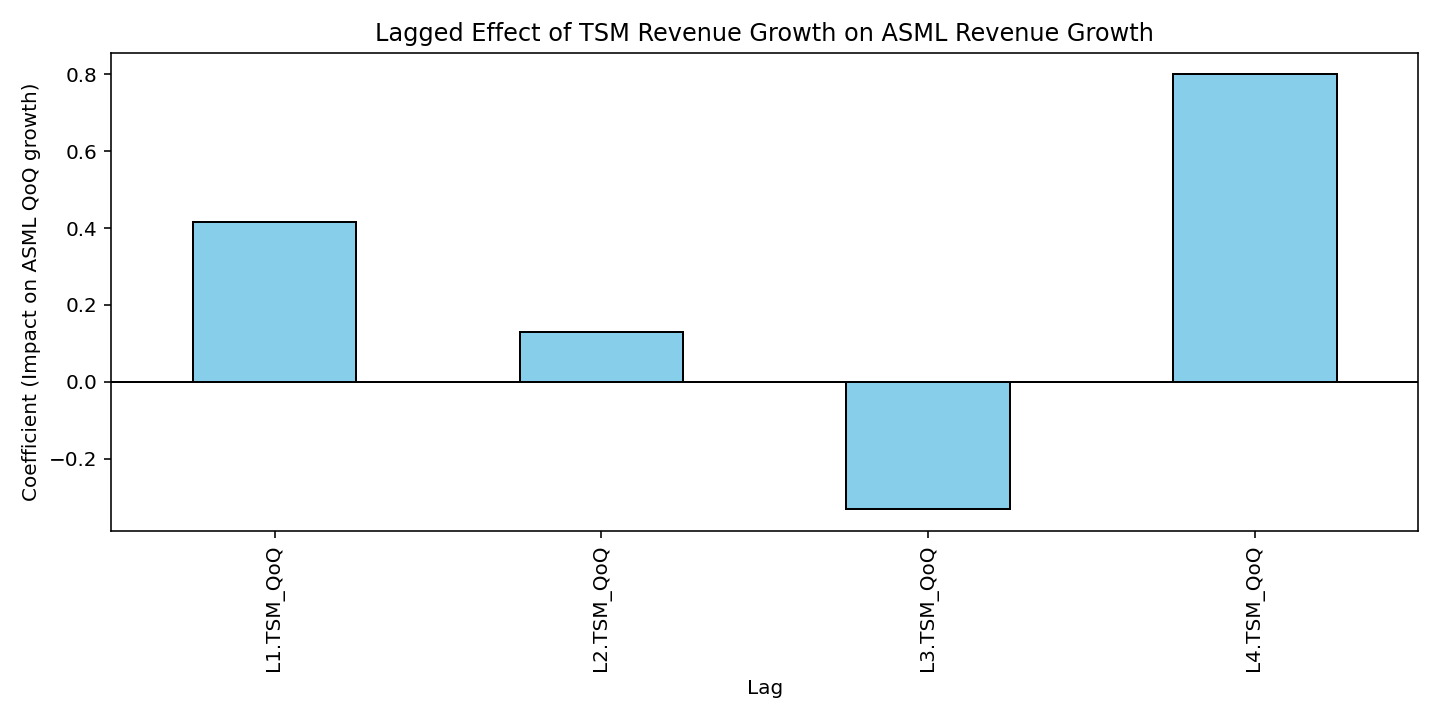
Figure 8
Conclusion
We have seen results of predictive power in the short- and long-term. These results do not tell us how to perfectly predict ASML returns based on clients historical stock returns. But it provides evidence of a predictive relationship, which can be used as an indicator for example.
We have seen that the larger clients TSM and Intel have significant predictive power. TSM which focuses only on producing chips not only has the highest correlation with ASML, but also the most significant predictive power short- and long-term. Apparently, there is some significant lag between the organizations, which is quite intuitive given their business relationship. We see the same pattern in the revenue relationship between these assets. An year-on-year quarterly increase of revenue from TSM has a positive effect in general on the quarterly revenue of ASML, mainly exactly one year later. It is likely TSM will have an increase in revenue this year and the coming years due to the high demand for chips. Will the revenue and stock price of ASML follow? The analysis says it is likely to follow
Appendix
References
Fitch Ratings (2024, May). Fitch upgrades asml to "a+"; outlook stable. https://www.fitchratings.com/research/corporate-finance/fitch-upgrades-asml-to-a-outlook-stable-17-05-2024. Accessed: 2025-08-21.
Reuters (2025, March). Asml's annual report says export curb worries hit customer spending in 2024. Reuters. Accessed: 2025-08-21.
 | A guest post by
|