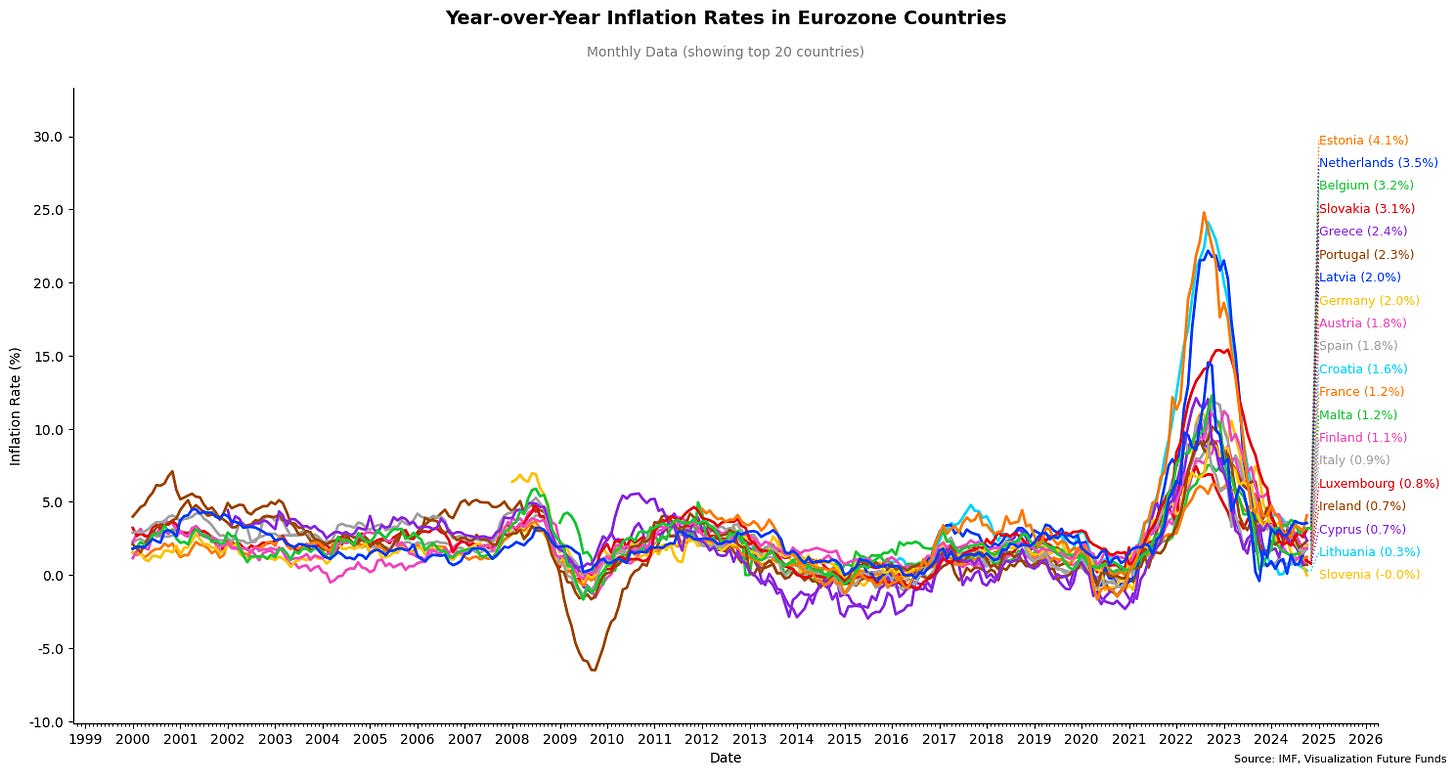
I am sure everyone reading this remembers the inflation shock felt in 2022. Covid is over, everything is good right? Wrong! Prices of basic needs started soaring making sure that everyone felt the inflation wave. A lot of coverage latetly has been done on US inflation, but I do not want to forget our home continent, Europe. As discussed earlier, the ECB (European Central Bank) has a hard time managing all different economies using one currency. Therefore it is interesting to see which countries have been hit the hardest and how and what inflation here in Europe is doing at the moment.
Inflation in different eurozone countries
Inflation in Europe is a hard topic, unlike the US we are not talking about one specific country. In Figure 1 the inflation rates of all different members of the eurozone are shown, we see that usually countries have quite similar inflation rates, but when things get extreme, some countries suffer even more. An interesting appearance can be seen around 2008 where Ireland suffered very badly from deflation. You might think, too much inflation is bad, so is deflation then not a good thing? Unfortunately it is not, deflation means that goods become cheaper and cheaper. This might sound attractive for you the consumer, but on a grander scheme of things it also means less and less spending. As you, the consumer, anticipate that in a bit the prices will be lower, you will probably postpone your spending as you think you will have a better deal later. This means businesses make less money, which results in firing of employees, which eventually will result in less economic activity, this is called a deflationary spiral.
Going to examples a bit closer to the present, let’s take the Baltic countries around 2022, in Europe everyone suffered from a spike in inflation. But these countries have had a spike of around 25% in a year! If we compare this to Germany, our big boss of Europe. These countries suffered inflationary pressures three times worse. You might have felt your cup of coffee go up in price, but this is not even close to what these countries have felt. It makes sense that these countries got hit the hardest as they have a close economic connection to Russia. The sanctions on Russia hit the Baltics even harder than the rest of Europe and caused severe inflation.
Figure 1
The GDP Weighted European Inflation
To be able to get a feel of “European” inflation, we have to make a model. My first idea is to take the real GDP and use this as a country's weight for the European inflation model. In this way if a country is big in an economic sense, its inflation data contributes more to European inflation. When we multiply these weights by inflation data for each country we can kind of compress all of it into one inflation measure, which I call European inflation. Figure 2 shows the result of this process. It is important to note that the shaded areas are the maximum and minimum ranges of inflation. I put in a few countries in the figure to easily show what I mean with this. We can go back to 2008, where we see that Ireland was the minimum of this graph. While we can see that Estonia contributed to the maximum peak in inflation around 2022.
A noticeable observation is that Germany hovers the closest to our European inflation, this makes sense as Germany is the biggest economy in Europe. This could also raise concerns for policy making regarding fairness. If Germany is important in Europe's inflation management, it could mean that the Central Bank is more inclined to keep Germany's economy optimal while disserving other countries.
Figure 2
Europe against the US
Now that we have established a central inflation model for Europe, we can compare the European situation against the American one, this is done in Figure 3. I kept the minimum and maximum shaded areas in the plot as it is important that inflation is made up out of all countries using the Euro. It can be seen that Europe's inflation is further down than American inflation, which would indicate that cutting rates is appropriate, the mean of Europe is at 1.8% which is below the aimed 2% the ECB strives for. Meanwhile the US hoovers around inflation of 2.6% which means they are not quite there yet.
What is important to notice as well is that it looks like European inflation is extremely correlated to US inflation. Usually we see that the US moves first, whereafter we get pulled along their direction. This happened in 2008 during the big real estate crisis regarding deflationary pressures and it happened in 2022 regarding inflationary pressures.
Figure 3
The tail of history and why you should care
Figure 4
As we now see that European inflation is quite closely correlated with the US, we can start to look into US history to see what potentially lies ahead of us. As the Euro only exists for 20 years, there is not much data we can use on it. If we compare the current inflation situation to the 1980s seen in Figure 4 we can see striking similarities. Would this imply inflation will give us a second worse wave? Only time will tell us the story. Knowing where inflation can go is important for you, as this determines the actions the central banks will take. Higher inflation is not fun, but worse is that inflation eventually means higher interest rates which are a burden on the economy as discussed in our previous article about Europe. Be aware of the possible scenarios that could lay in front of us to keep your Future Funds safe!


