You might feel uncertain in the markets. You may understand if a company is good or not, but you do not have any idea what a valid price is. Is heineken too cheap, or is it too expensive? Fortunately there are tools out there that can help us starting investors with pricing a stock. A simple method has already been taught in one of our previous articles. But the Discounted Cash Flow, in short, DCF is a type of valuation that every investor should have a solid understanding of. In this article I will go through the mechanics of it and how we do this type of analysis.
Seeing a Stock As a Money Printer
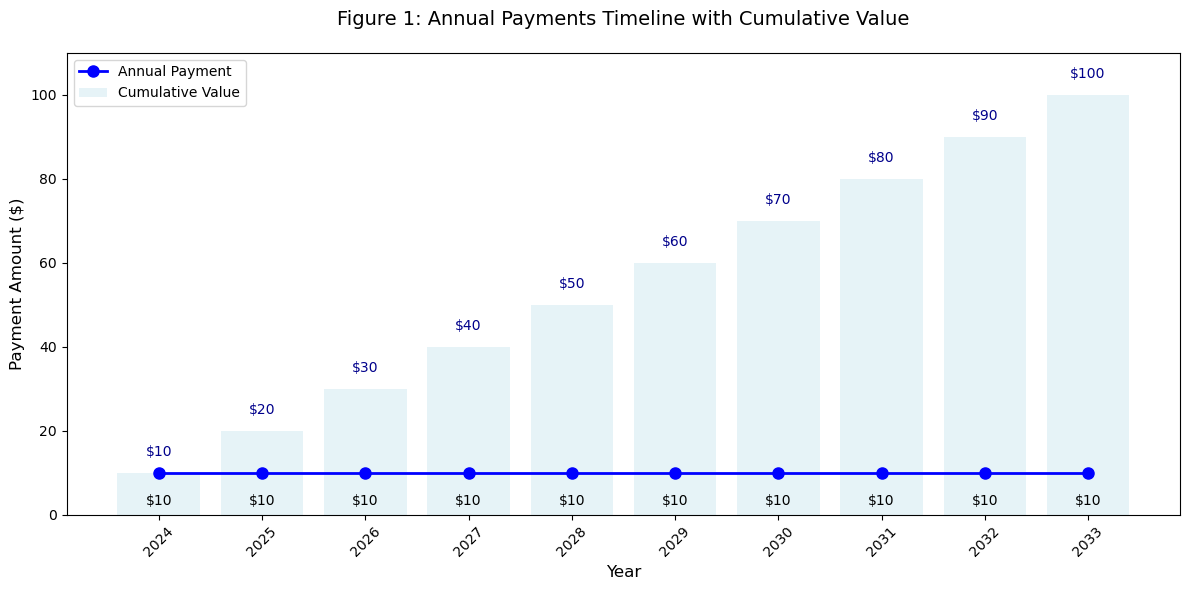
A DCF is a valuation method that looks at the money that a firm is likely to generate in the future. You as an investor basically try to estimate how much money you will get in the future for buying the stock now. You can see a stock as a small money printer, you buy it and it will with a given certainty produce cash for you in the future. I will illustrate this with an example, let's say your money printer produces 10$ each year for the coming 10 years. After 10 years the money printer is broken and will not give you any new money. After a simple calculation you can figure out that this money printer will yield you 100$ over its lifetime. Now the question is how much are you willing to pay for this money printer? As long as you have paid less than 100$ you can expect that you will not lose money on this investment opportunity. The payment structure can be seen in Figure 1. You see the cash flows you receive and the total amount that adds up to each period.
Figure 1
Account for The Time Value of Money
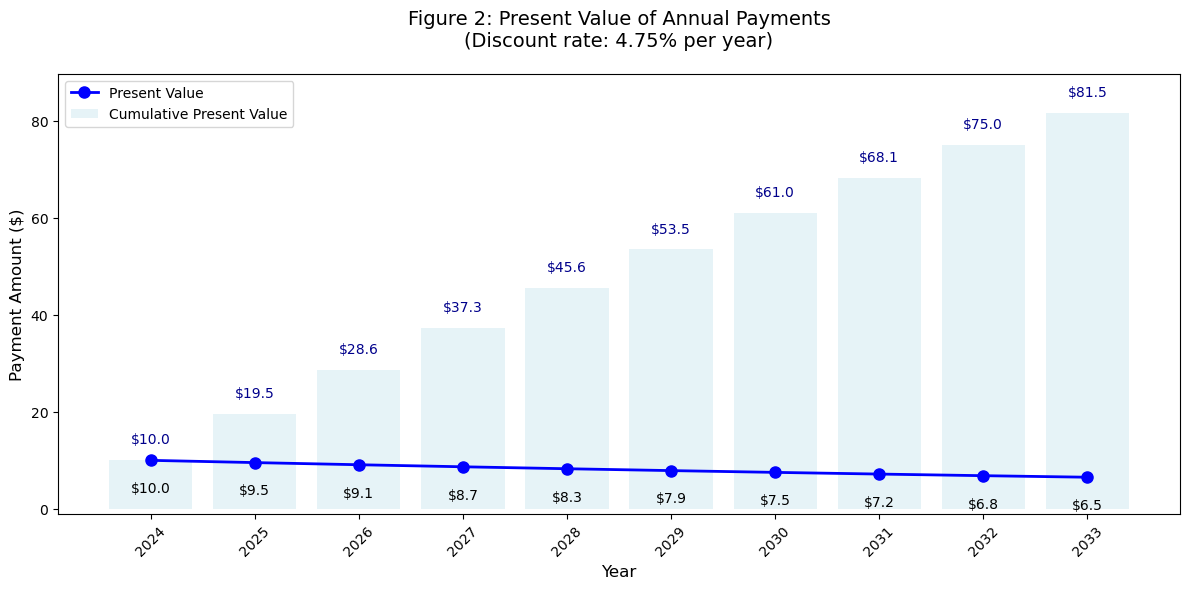
As I already said this was a simple exercise, let's add a new layer to this. There is one crucial problem with this way of thinking, what is? It is that money today is worth more than money tomorrow! We are yet again back to inflation, if you want a refresh on this subject I recommend reading our article on it. To continue with this, we have to discount our future income streams to determine what the value of this money printer is. In this case we are going to say that our alternative is storing our money at the risk free rate, this can be seen as what you will earn when you leave your money in a high yield savings account. The risk free rate for the United States is currently 4.75%. Let's add this discount to our calculation, how do we do this? We multiply for each cash flow with e^(-0.0475*T) where T is the time the cash flow got paid. If we incorporate this we can get the present value of our money printer. The present value is basically what the stream of payments is worth after accounting that money today is worth more than money tomorrow. The results of this incorporation in our model is shown in Figure 2.
Figure 2
As you can see now the value of this money printer is not $100 but actually $81.5! This is a big difference and is crucial to understanding how future cash flows work. If you would have paid $90 for this money printer you might think that you have a good deal, but the reality is that you could have better put the money in a high yield savings account than invest in this imaginary money printer.
Adjusting Our Money Printer For Risk, Introducing the WACC
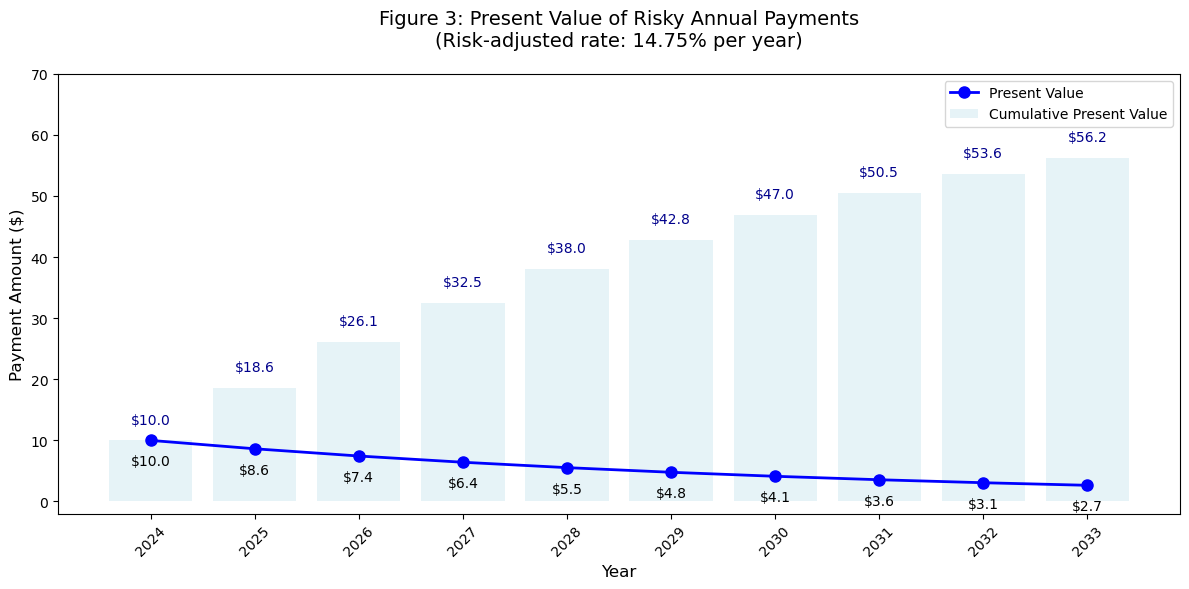
But wait, there's more to consider! Remember that our previous calculation assumed the money printer was completely reliable. In reality, the printer has a 10% chance of breaking down each year. This makes our future cash flows more uncertain, we're less confident about receiving those $10 payments in later years. To account for this risk, we need to add a risk premium of 10% to our discount rate, bringing it to 14.75% (4.75% risk-free rate + 10% risk premium).
As shown in Figure 3, this higher discount rate dramatically affects the present value of our future cash flows. The money printer is now worth only $56.2! This makes intuitive sense, we're willing to pay less for a machine that might break down compared to one that's guaranteed to work. This is exactly how investors think about risky companies versus stable ones, the more uncertain the future cash flows, the less they're worth today. Now we understand everything about future cash flows and we can start going out of the theory into practice!
Figure 3
What Do We Use for Stocks? The Weighted Average Cost of Capital.
As seen before it is important to take risks of future cash flows into account. But how do we do this for stocks? Do we add 10% as our risk premium, 20% or maybe only 5%? There is something that a lot of investors use to help them with answering this question, it is called the Weighted Average Cost of Capital, better known as WACC. The WACC can basically be seen as the risk adjusted discount rate for a particular company, after calculating this number you will be able to determine how ‘risky’ the future cash flows of your corresponding company are and with what to discount it. Let's get into it, the formula for the WACC is:
WACC = (Percentage of Equity x Cost of Equity) + (Percentage of Debt x Cost of Debt x (1 -Tax rate))
Where:
Cost of Equity = Risk Free Rate + (Beta x (Expected Market Return - Risk Free Rate))
Do not worry, if it looks really intimidating, in the end it is all about filling in the right numbers in the right areas. Some of the terms we have already gone over and some we have not. Because I can't have this article too long I will just do an example with you for Heineken stock. If you have any questions about this specific part, ask them in the comments and or send the page a message, I am happy to respond!
We will start with the cost of equity, the risk free rate is 4.75% and historically the expected market return is 9%. We will google the beta for simplicity, which yahoo says to be 0.62. In short you can see the beta as how heavy a stock reacts to movements in the broad market movements. Heineken has a beta less than 1 so is less sensitive. The Cost of Equity is 7.85% after calculations. If we look at the equity (market cap) and the net debt of Heineken, according to its last balance sheet on yahoo finance we get to the percentages of 71.9% for equity and 28.1% for debt. Heineken's cost of debt is approximately 4.62%, calculated from the interest they pay relative to their total debt. Taking their tax rate of 26.8% into account, and blending this with the cost of equity, the weighted average cost of capital (WACC) comes out to about 6.59%.
The Discounted Cash Flows of Heineken
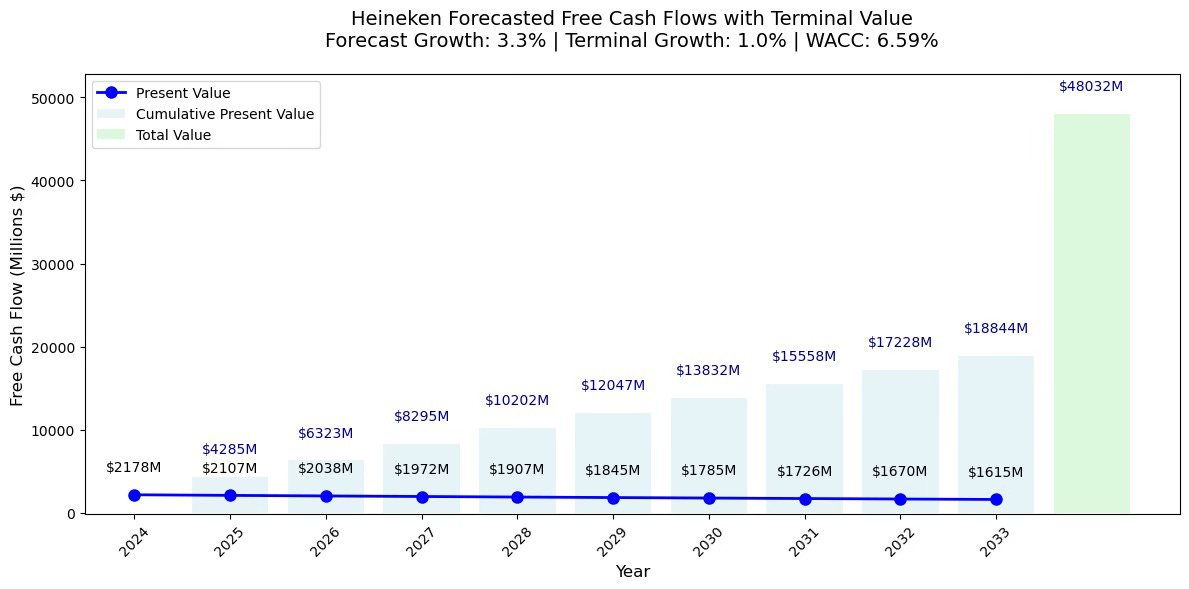
Now let's take our money printer concept to the real world by looking at Heineken. Instead of a fixed $10 payment each year, Heineken generates billions in cash flow that tends to grow over time. The historical cash flows from 2014 to 2023, grew on average 3.3%. A simple assumption that we can make is that Heineken will have the same growth in cash flows in the future as it had in the past. Adjusting these future cash flows for risk and time value of money, using Heineken's WACC of 6.59%. We can almost define what the value of Heineken as a company is. As Heineken will have a high likelihood that it will keep on being a business after 10 years from now, we should account for these cash flows as well. But as these cash flows are really far away and hard to determine, we do use a slower growth rate as history suggested. This is the Terminal Growth rate, it is normal to place it between 1% and 2%. This then accounts for all the other time periods after 2033 and adds this value on top of the last cumulative cash flow. The result can be seen in Figure 4 and what do we see there? We see that according to our model Heineken is undervalued by almost 20%, as the current market cap is around 40 billion. This type of analysis makes us able to value a company in a more detailed way.
Figure 4
Why You Should Care!
The DCF approach is a powerful tool to model a company's future finances. You can see a DCF as somewhat of a crystal ball for looking into the future performance of the business or in this article's case the money printing machine. When you want to buy a stock it is important to make an educated guess about what is a fair value for the stock. A discounted cash flow, when done correct, is a perfect way to do so. A discounted cash flow can go much deeper than my illustrated example. But the main goal should be that you now fully understand the mechanics behind such an analysis. Remember, when buying a stock you buy a company with Real Value, therefore knowing what to pay is crucial.


