
How is the Yield Curve Doing?
Has the soft landing officially taken place?

The first article ever written by Future Funds has been about the yield curve (check it out here). Now, almost half a year further, the economy seems to boom as never before and growth seems limitless. Because of these wonderful prospects, we should maybe revisit this topic to determine if this “soft landing“ has already happened, or that we should maybe temper expectations as investors.
The “soft landing”
A soft landing represents one of the most challenging objectives in monetary policy - successfully transitioning an economy from a period of high growth and inflation to stable, sustainable growth without triggering a recession. The Federal Reserve has been pursuing this goal through an aggressive interest rate policy, as clearly visible in Figure 1, where we can see one of the steepest rate hiking cycles in recent decades, with the Federal Funds Rate climbing rapidly from near-zero to exceed 5%.
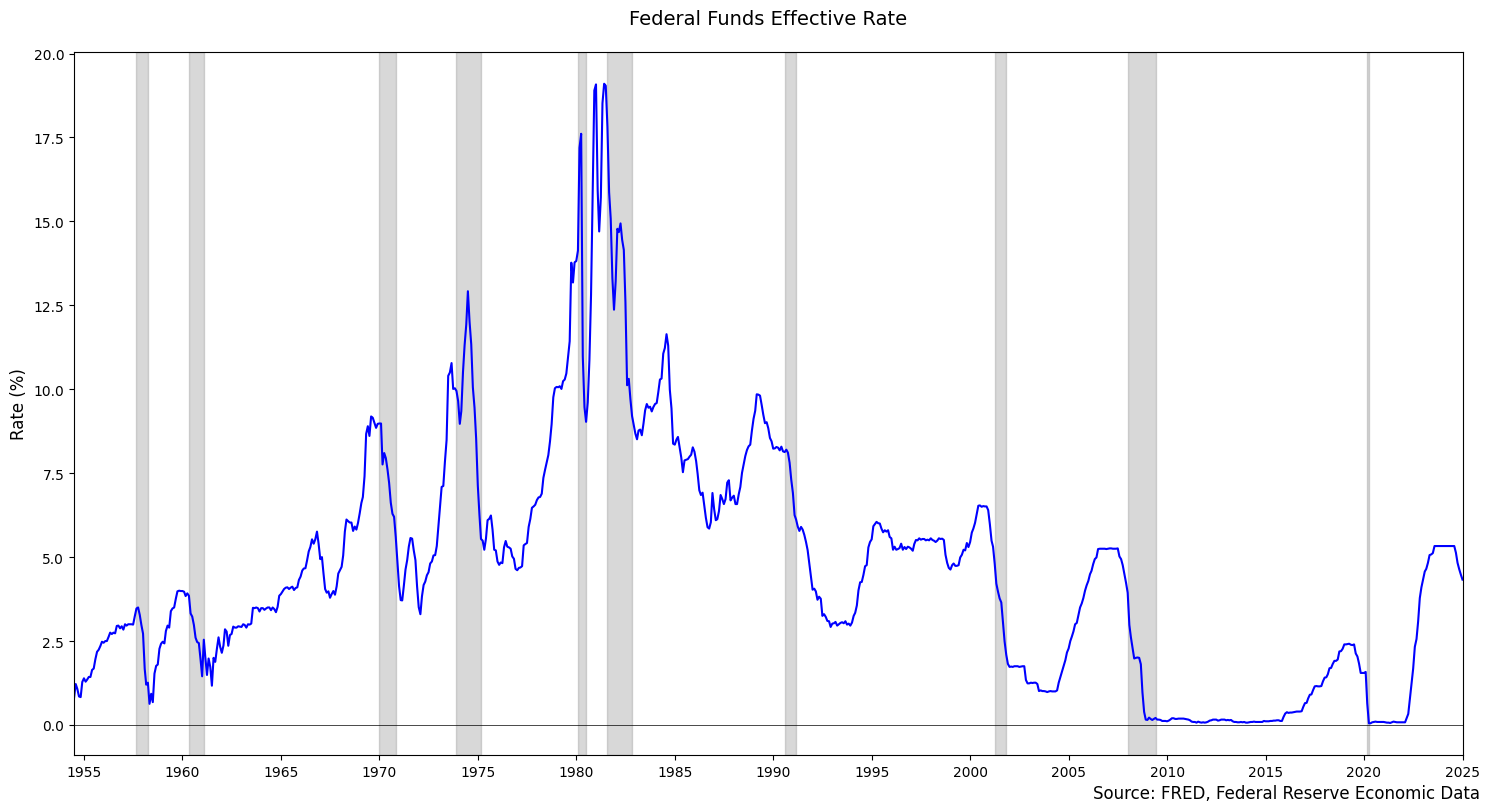
Figure 1
Historically, soft landings have been exceptionally rare in modern economic history, with the 1994 period under Fed Chairman Alan Greenspan standing as the only clear success story in recent decades. Looking at Figure 1, this period is notable for its measured rate increases without turning this into a recession. Yet as we enter early 2024, many economists are suggesting we're witnessing another successful soft landing. The supporting evidence is compelling: inflation has moderated significantly while maintaining robust employment levels, equity markets are reaching historic highs, and consumer spending continues to show remarkable resilience.
The Federal Funds Rate trajectory shown in Figure 1 underscores just how extraordinary the current situation is. While the rate increase mirrors the aggressive hikes seen in previous cycles (particularly the 1980s), the economy has demonstrated unprecedented stability. Historically, such dramatic rate increases (as shown by the sharp upward movements in the blue line) have often preceded recessions or economic slowdowns (marked by grey shaded areas in the graph). However, the current cycle appears to be defying historical patterns, potentially achieving what many economists once considered nearly impossible, a successful soft landing despite aggressive monetary tightening.
The yield curve and recessions
The yield curve, specifically its un-inversion point, has historically served as a reliable indicator for economic transitions. As shown in Figure 2, the spread between 10-year and 2-year Treasury rates provides crucial insights into potential economic shifts. The historical data presented in the figure demonstrates a consistent pattern: when an inverted yield curve returns to normal, significant economic events tend to follow.
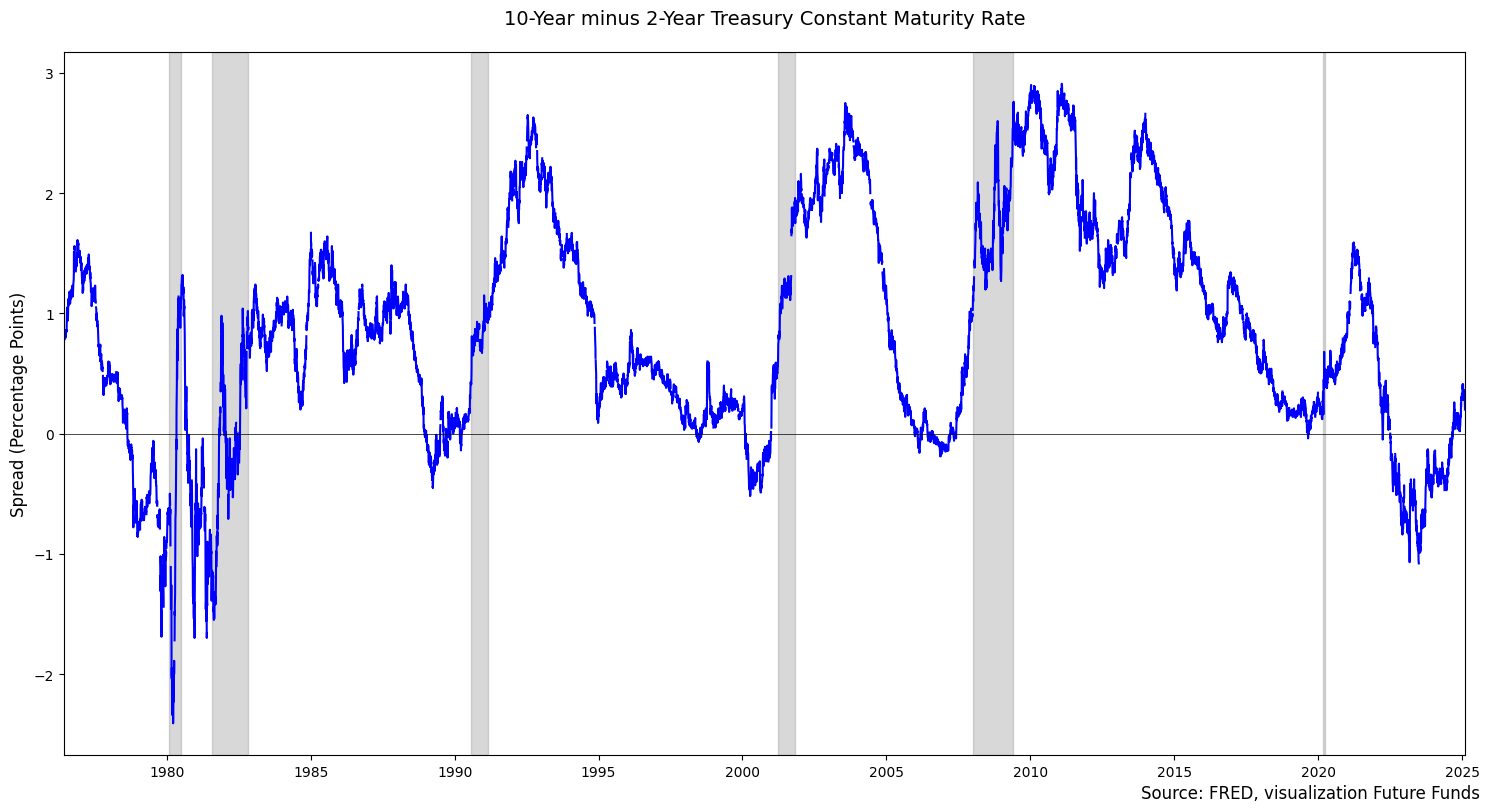
Figure 2
Looking at the historical data, we can observe a clear relationship between yield curve uninversion dates and subsequent recessions. The data from our analysis reveals a pattern worth examining:
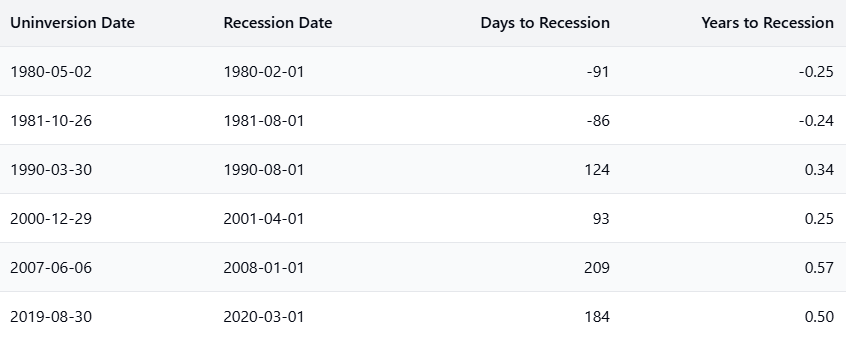
Our current situation shows that we're 158 days (0.43 years) into the post-uninversion period. Notably, the early 1980s cases demonstrate that recessions can even begin during the inverted period, not waiting for uninversion to occur. When comparing our current timeline to historical patterns, particularly the 2008 Financial Crisis which saw 209 days between uninversion and recession, we might be premature in declaring a successful soft landing.
The historical data suggests that a recession could still materialize in the coming months. Despite current strong economic indicators, the 158 days since uninversion falls well within the typical pre-recession window seen in past cycles. The declaration of a successful soft landing appears premature - a recession remains a distinct possibility based on these historical patterns.
Implications for you
Despite markets reaching historic highs and widespread optimism about a soft landing, the yield curve's historical record demands a more cautious perspective. With 158 days since yield curve un-inversion, we sit squarely within the typical pre-recession window seen across multiple cycles. Even the 2008 Financial Crisis, with its longer 209-day runway, ultimately ended up in a recession, and that's after markets had similarly celebrated apparent economic strength.
For investors, this contrast between current market euphoria and historical patterns creates an urgent need to temper expectations. Keep a close eye on three critical indicators that could signal trouble ahead: unemployment rates, corporate default rates, and inflation trends. The yield curve's message is clear - celebrating a soft landing now, despite attractive market returns, could be too early.